Data Collection and Presentation
Free
About This Course
Learners are introduced to basic statistical techniques, including how to design a data collection method, organize data into tables, and present it using graphs such as bar charts, pie charts, and histograms. The topic also involves interpreting real data and making informed decisions based on graphical information.
Learning Outcomes:
The learner should be able to:
- Collect, record, and organize raw data.
- understand the differences between types of data.
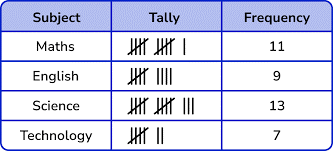
- collect and represents simple data from the local environment using tally chart, bar chart, pie chart and line graph.
- Present data using various charts and graphs.
- Interpret and analyse presented data.