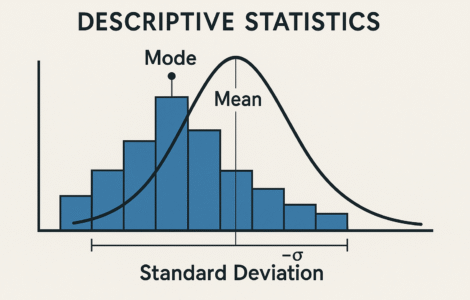
Descriptive Statistics
Free
About This Course
This topic introduces methods for collecting, organizing, summarizing, and presenting data. Learners will work with measures of central tendency, dispersion, and data representation techniques to interpret statistical information meaningfully.
Learning Outcomes:
The learner should be able to:
- Organize data using frequency tables and diagrams.
- Organise data with equal class width and represent it graphically (histogram and ogive) and make presentations.
- Interpret graphical data representations such as histograms and O-gives.
- Present data with un equal class width on the histogram and use it to estimate mode.
- Present data with un equal class width on the histogram and use it to estimate mode.
- Calculate mean, median, mode, variance, quartiles, percentiles and standard deviation of classes with equal and unequal class width.
- Apply descriptive statistics to real-world data.
- analyse data in order to predict phenomena for purposes of decision making and community development.