Scatter Diagrams and Correlations
Free
About This Course
This topic explores relationships between two quantitative variables using scatter diagrams and correlation coefficients. Learners will learn how to interpret the strength and direction of linear relationships and understand their significance.
Learning Outcomes:
The learner should be able to:
- Record and tabulate the values of any two variables.
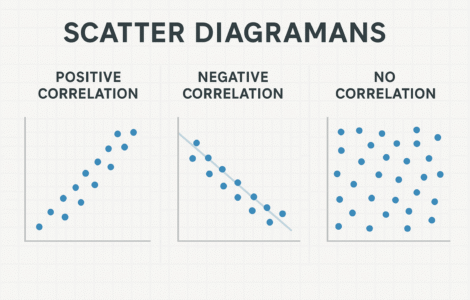
- Construct and interpret scatter diagrams.
- Draw the line of best fit and comment on the relationship between the two variables.
- Understand positive, negative, and no correlation scenarios.
- Rank data, compute and interpret Spearman’s and Kendall’s rank correlation coefficients of a set of data.
- Use correlation analysis to inform decisions and predictions.
- Recognize limitations and cautions in correlation analysis.